Location:Home > APPLICATION
-
 2023-11-02 MORE
 -
 2023-09-26
Analysis of Near Field and Blind Areas in Ultrasonic Testing
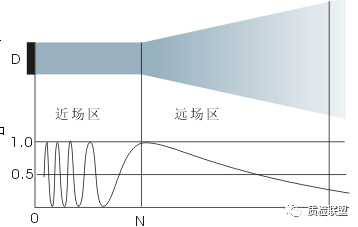
In ultrasonic testing, two easily confused concepts are often encountered: blind zone and near field zone. Today, we will briefly differentiate and analyze these two concepts. 1. The near-field zone is mainly caused by the interference of sound waves near the wave source, while the blind zone is mainly caused by the characteristics of the instrument's emitted pulses and the performance of the amplifier. 2. The ultrasonic pressure in the near field area is irregular, and the quantification of defect echoes is not accurate; Blind spots are areas where the defect echo signal cannot be amplified and displayed. 3. The length of the near field is calculated, and the size of the blind spot is measured through testing. 1、 Near field region 1. Near field concept: The near-field region, also known as the Fresnel region, is an area where a series of maximum and minimum sound pressure values appear near the wave source due to wave interference. The distance from the last maximum sound pressure on the axis of the wave source to the wave source is called the near-field length. The presence of near field areas can lead to inaccurate quantification of defect echoes. 2、Calculation formula for near field region: The formula for the near-field length of longitudinal waves in a circular source: (Where Ds is the diameter of the disk source, λ Is the wavelength) The formula for the near-field length of longitudinal waves in rectangular sources: (Where Fs is the area of the rectangular source, λ Is the wavelength) 3、Factors affecting the near field region: The larger the area Fs of the sound source, the greater the near-field length N; The higher the frequency f, the longer the wavelength λ The smaller the distance, the larger the near field length N 二、blind area 1、The concept of blind spots: The emission pulse of the emission circuit of the ultrasound instrument excites the probe and directly enters the receiving circuit, forming a starting wave. Due to the high emission pulse voltage, the amplification factor of the amplifier will decrease or even have no amplification effect in a short period of time, which becomes a blockage. Due to the inherent width of the transmitting pulse and the blocking phenomenon of the amplifier, the amplifier is unable to respond to the input signal after the transmitting pulse begins. During a period of time near the initial wave, the required defects are often undetectable. Specifically, in the inspected workpiece, the corresponding depth distance from the incident surface to the workpiece during this period becomes a blind spot. Blind spots can also be represented by time domains: The dead time after transmitter pulse refers to the time during which the amplifier becomes saturated due to the transmission of pulses during pulse echo technology, making it unable to sound the input signal after the start of the transmission pulse. Similar provisions are adopted in the standards "EN12668.1:2010 Non destructive Testing - Ultrasonic Testing Equipment - Characteristics and Verification - Part 1: Instruments" and "ISO22232-1-2020 Ultrasonic Testing Equipment - Characteristics and Verification - Part 1: Instrument Performance Part". 2、The influencing factors of blind spots: 1. The emission power of the instrument: high emission power, high detection sensitivity, high signal strength, wide initial pulse, and large blind spot. So, under the premise of achieving the required detection sensitivity, reducing the transmission power can reduce blind spots. 2. Signal bandwidth: The narrower the signal bandwidth, the larger the signal pulse width, and the larger the blind spot. So increasing the combined bandwidth of the instrument and probe can reduce blind spots. 3. Design of the probe: For example, using a delay block can reduce blind spots, the dual crystal probe adopts a one send one receive form, and a sound insulation layer is used to isolate the transmitting and receiving chips, overcoming mutual interference and blockage between the transmitting and receiving sound beams. At the same time, there is also a delay block, which can effectively reduce blind spots. 3、Blind spot testing: There are generally two types of blind spot testing: The first type is to measure the dead time after transmitting pulses: According to the corresponding parts of EN12668.1:2010 and ISO22232-1-2020, the time is obtained, and the general requirement is not more than 10 μ S. The test schematic diagram specified in ISO22232-1-2020 is as follows: The second type is approximately tested using test blocks: The general principle is to detect reflectors of different depths, find the nearest reflector, and require that the echo of the reflector can be independently recognized from the initial pulse. The closest distance is the blind spot. The distance obtained. Usually, the CSK-1A test block is used Φ Measure the size of the blind spot by measuring the distance between the circular arc surface of 50 organic glass and the edges of both sides by 5mm and 10mm. If the probe is placed at position I and there is an independent echo, the blind spot is less than or equal to 5mm. If there is no independent echo at point I and an independent echo at point II, the blind spot is between 5-10mm. If there is still no independent echo at point II, the blind spot is greater than 10mm. (The term 'independent' here means that when the echo height exceeds 50% of the full screen, and the valley where the front edge of the echo intersects with the back edge of the initial wave meets the requirement of less than 10% of the full scale.) Blind spot testing can also be conducted using the blind spot test block DZ-I. The testing principle is also the same, using the distance of the hole corresponding to the echo of the shortest distance hole that can be independently separated from the initial pulse as the blind spot.MORE -
 2023-09-26
Ultrasonic phased array detection of wind power spindle
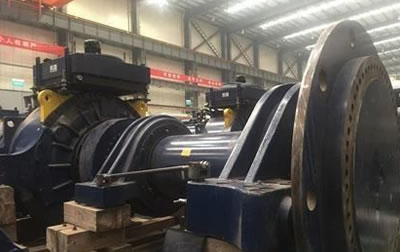
Background Wind energy, as a clean and renewable energy source, has received worldwide attention. The development trend of wind turbines is towards higher power, lighter weight, lower cost, and higher reliability. From the perspective of increasing power and reliability, foreign countries have conducted more research and application on new transmission chains, and developed various transmission schemes such as integrated, split flow, and direct drive to cooperate with medium and low speed generators. The spindle is a key component in wind turbines, and its design safety and rationality will directly affect the performance of the entire unit. The phenomenon of spindle fracture also occurs from time to time, which has prompted wind power companies to pay more and more attention to the research of in-service detection methods for wind turbine spindles. Test method The wind turbine shaft is divided into many different types due to different models, and the structure of each type will also vary greatly. Moreover, due to in-service testing, the accessible parts for different models are also different. So for each different model, different testing processes and methods are required. The area where probes can be placed can be generally divided into two parts: the shaft surface and the shaft end face. There are different phased array probes and settings for these two parts, and most of the detection focuses on defects such as cracks on the outer surface of the shaft body. The shaft end face uses a 0 degree contact phased array probe, and the visible sound beam can cover the entire outer surface of the shaft surface. The axis body surface can be detected by using an oblique incidence probe and refracting secondary waves through the central hole Combining zero angle and oblique incidence probes can basically be suitable for detecting different types of fan shafts Detection result The inspection results of the shaft end face are shown in the following figure, and each geometric shape reflection is clearly visible, and the signal in the front threaded area can be seen, as shown in the red circle. The detection results of the shaft surface are shown in the following figure. Using the center hole as the reflection surface, the thread signal at the rear end can be seen, as shown in the red circle. Cnclusion By using ultrasonic phased array technology, the geometric reflection of each part can be clearly observed in the detection of the shaft end face and shaft body surface, and the signal display position and depth match the actual geometric shape. Therefore, using ultrasonic phased array technology can also detect crack like defects on the shaft body.MORE -
 2023-09-26
Al honeycomb board and fiberglass honeycomb board phased array C-scan detection
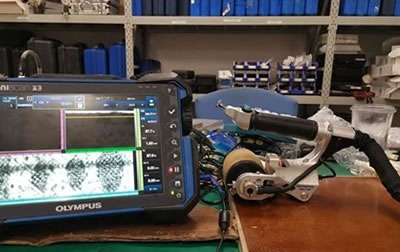
1. background Composite materials with honeycomb structures were first used as important support structures in aerospace due to their high strength and compressive strength. With the development of technology, honeycomb structural composite materials are also widely used in various fields, including railways, building decorations, ships, and so on. Especially for the composite materials of Al skin/Al honeycomb structure, the center is made of aluminum hexagonal honeycomb, with a low density (approximately 3-7 kilograms per square meter), which is 1/5 of the weight of wood boards of the same thickness and area, 1/6 of glass, and 1/7 of aluminum, greatly reducing building load and cost. Due to the large amount of air in the middle interlayer, it can provide sound insulation (air sound insulation can reach 30dB), thermal insulation (thermal resistance can reach 0.02 (㎡· K/W)), and no combustible substances, The fire resistance rating reaches B1 level, which is waterproof, moisture-proof, and free from harmful gas release. It has a high specific strength and stiffness per unit mass (1.7 times the structural stiffness of the ribbed structure), and is not easily deformed. The detection of honeycomb composite materials has always been a difficult point in testing. Previously, ultrasonic water spraying systems were mainly used for the detection of aerospace honeycomb composite materials, which were complex in structure, expensive in cost, and inefficient. They were generally only used in aerospace composite manufacturing enterprises to detect complex shapes and environments with high detection requirements. This experiment uses a brand new ultrasonic phased array detection technology for detection, which is efficient, displays clearly, and has reliable detection results. The equipment or system cost is lower than that of the water spraying system, and is suitable for aerospace composite material repair and maintenance enterprises. 2. Configuration of detection equipment Host: Omniscan X3 phased array ultrasonic testing system Probe: 5MHz, 64 chip wheel ultrasonic phased array probe. 3. Analysis of test results Test block (1) Material: aluminum skin/aluminum honeycomb core, skin thickness: 0.3mm The inspection results of side A on test block (1) are as follows, where four artificial defects can be clearly seen and the honeycomb structure is clearly visible. The inspection results of B-side on test block (1) are as follows, with 8 artificial defects clearly visible and the honeycomb structure clearly visible. Test block (2) material: aluminum skin/aluminum honeycomb core, skin thickness: 1mm The inspection results on test block 2 are as follows, and a clear honeycomb structure and internal artificial defects can also be seen. Test block (3) material: Glass fiber reinforced polymer (GFRP) core structure, skin thickness: 0.3mm The inspection results of side A on test block 3 are as follows, and four artificial defects can be clearly seen. The inspection results of B-side on test block 3 are as follows, and four artificial defects can also be seen. 5. Conclusion The use of ultrasonic phased array technology, combined with wheeled probes, can effectively detect the debonding of Al alloy honeycomb and GFRP honeycomb structural composite materials. The detection results are clear and reliable, and the complete structure of the hexagonal honeycomb can be observed, and it is sensitive to defects.MORE -
 2023-09-26
Application of Digital Ray DR in Pipeline Corrosion Detection
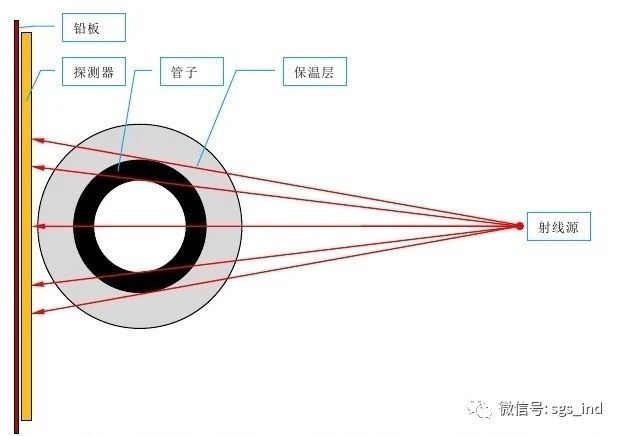
In the petrochemical industry, some pipelines operate at high or ultra-low temperatures for a long time, and are susceptible to chemical and electrochemical reactions from internal materials and external media. Pipelines are prone to corrosion and wall thickness reduction, resulting in safety hazards, and even serious leakage or explosion accidents. In order to ensure the safe operation of pipelines during the inspection cycle, it is urgent to achieve online detection of pipeline defects and hidden dangers. However, for pipelines with insulation layers, traditional detection methods are difficult to implement. The main difficulty lies in the need to remove a large amount of insulation layer during testing. The high temperature on the surface of the pipeline after removing the insulation layer may affect the testing results, and secondary corrosion may also occur after restoring the insulation layer after testing. Therefore, choosing a reliable pipeline insulation layer detection technology is of great significance. At present, commonly used pipeline insulation layer detection techniques include pulse eddy current testing, magnetic flux leakage testing, and film radiographic testing, but each has its own limitations. When pulse eddy current technology is used to detect pipelines with insulation layers, the ferromagnetic substances in the surrounding pipelines and insulation layers may interfere with the extraction of feature signals. The uneven thickness of the insulation layer can also interfere with the detection results, and the detection sensitivity for local corrosion is low. Film radiographic testing technology has disadvantages such as low detection efficiency, low tolerance, difficulty in long-term storage of films, and unfavorable digital filing. Magnetic flux leakage detection technology can only detect large corrosion pits, and the images are not intuitive. X-ray digital imaging (DR) technology can achieve pipeline corrosion and defect detection without removing the insulation layer. When using this technology for detection, the rays penetrating the inspected pipeline are received by a digital detector array (DDA) and directly converted into digital image display, without the need for darkroom processing. It has high tolerance and detection efficiency, and can automatically measure pipeline wall thickness, corrosion pits, pipe diameter, etc. Digital radiographic images can be viewed on screens such as computers, tablets, and mobile phones, making them easy to store, call, transmit, and share. This greatly facilitates pipeline integrity assessment and monitoring in industries such as petroleum, chemical, power, machinery, metallurgy, pharmaceuticals, and food processing. 1.DR Fundamentals DR technology utilizes X-rays or γ Due to the attenuation characteristics, the intensity of rays transmitted from different thickness areas will weaken to varying degrees relative to the incident intensity when the rays penetrate the inspected pipeline; The radiation passing through the workpiece is received by a flat digital detector and converted into a digital signal, which is sent to a computer for processing to form a digital image. DR technology is one of the fast and efficient X-ray imaging technologies, which can obtain digital images within seconds. Portable DR detection systems are generally composed of X-ray machines, digital detector arrays, computers, software, cables, power cables, network cables, etc. 2.Inspection schematic diagram 3.Application Legend Automatic measurement of wall thickness pitting corrosion Outer wall corrosion - thinning Weld defects - lack of fusion 4.summarize 1) DR technology can be applied to the detection of insulation layer in in-service high-temperature (ultra-low temperature) pipelines. It can efficiently detect and identify pipeline corrosion and accumulation, wall thickness measurement, and weld defects, facilitating the evaluation of safe operation of in-service or extended service pipelines and timely detection of hidden dangers. 2) DR technology solves the problems of production stoppage or dismantling of pipeline insulation layers caused by conventional inspection techniques for insulated pipelines, as well as the economic losses caused thereby. It also indirectly provides a basis for the evaluation of insulation layers. 3) The application of DR technology is in line with the current national policy of energy conservation and environmental protection. The detection sensitivity is high, fast, and efficient, reducing radiation dose, radiation hazards to employees and the public, and reducing radiation protection pressure. Without the use of film, the darkroom processing process eliminates the impact of chemical agents on the environment and personnel health. 4) Due to the limitations of the insulation layer and the inability of the digital flat panel detector to bend, the defect images on the detector side and the radiation source side have varying degrees of magnification. The determination of defects needs to be corrected based on the characteristics of the digital image and the comparison block. 5) In fact, DR technology can be applied not only to pipeline corrosion and weld defect detection, but also to casting detection of metal and its alloys and non-metallic materials, plastic, rubber, ceramics, composite materials, electronic components, assembly accuracy and structural integrity detection of important devices, mineral screening, cultural relics and archaeological identification, etc.MORE


