Ultrasonic phased array inspection of welds
Principle of Ultrasonic Phased Array S-Scan Image Recognition for Welding Seams
Conventional ultrasonic testing of welds is performed using fixed refractive angles -45 °, 60 °, and 70 °, while phased array ultrasonic testing performs acoustic beam scanning within a certain angle range.
Usually, the acoustic beam scanning range for phased linear array angle probe (transverse wave) detection is 35 ° to 75 °.
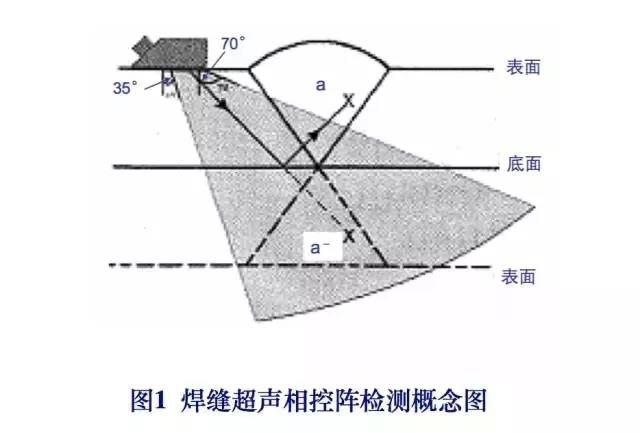
Figure 1 shows a cross-sectional view of the phased array ultrasonic probe for scanning the weld seam with a sound beam.
When using the direct beam method (i.e. single wave or 0.5S wave) for inspection, only the lower half of the weld seam is detected by the acoustic beam scanning; But when using the bottom reflection method (i.e. secondary wave or 1.0S wave) for detection, the sound beam can fully cover the entire weld cross-section.
For example, the defect a in the weld seam shown in the diagram can be detected by secondary waves and displayed as a mirror image a.
On the display screen of the phased array ultrasonic flaw detector, using a thickness range of 2.5 times, the entire weld volume can be displayed in a single image.
The following shows 9 phased array S-scan legends of typical welding defects for two typical welding joint types (V-groove single sided welding and T-joint combination welding).
Single sided welding defects include: weld toe cracks, lack of fusion near the bottom groove, lack of fusion near the surface, and dense pores; The defects of T-joint combination welding include: incomplete welding at the root, incomplete fusion on the wing side, cracks under the weld bead, and cracks at the weld toe.
For the convenience of image interpretation and evaluation, a corresponding cross-sectional diagram of weld seam detection layout has been specially added through specialized software, depicting the welding structure and the arrangement of linear array phased probes (including linear array oblique probes or linear array straight probes).
The S-scan diagram and detection layout diagram are the "focus" of spectrum reading for phased array ultrasonic testing of welds.
Note that the detection layout contains the propagation path (sound path) of ultrasonic waves in the inspected weld seam, especially when using primary reflected waves (i.e. secondary waves) for detection. The S-scan image of the secondary wave is represented by the extension image of the primary wave in twice the plate thickness. Any defects or weld seam contours detected using secondary waves are represented by "mirror images".
2.1 Weld toe cracks
Figure 2 shows the sound image of the weld toe crack detected by the probe's S-scan when detecting a single side weld seam in a V-shaped groove using a linear phased ultrasonic angle probe, as well as the corresponding cross-sectional view of the weld seam detection arrangement.
As the weld toe crack is located on one side of the detection surface, the defect was detected using ultrasonic secondary waves (or 1.0 S waves).
Figure 2 shows a mirror image of the inspected weld seam and defects.
The crack height is measured based on the depth distance corresponding to the propagation time difference between the crack tip angle echo and the diffraction signal at the crack tip.
The phased array height measurement indication value of the crack is 3.6mm, the measured value is 3.8mm, and the measurement error is -0.2mm.
The mirror image characteristics of the two signals of the weld toe crack should be carefully observed: the amplitude of the end angle reflection signal is very strong and the sound image is large, while the amplitude of the tip diffraction signal is weak and the sound image is small.
To accurately measure the height of the surface opening crack itself, special attention should be paid to the intersection position of the horizontal light marking line passing through the diffraction sound image of the crack tip (the vertical light marking line is the height extension line of the crack in the direction of plate thickness).
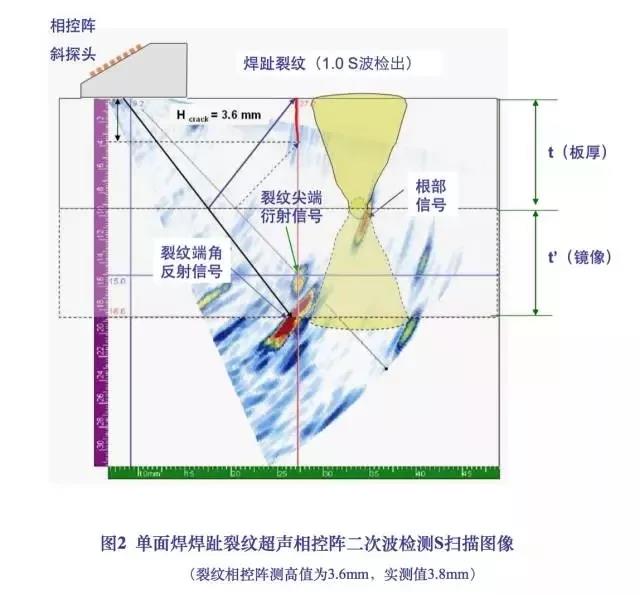
Figure 3 is a phased array ultrasonic primary wave S-scan image of the groove near the inner surface of the inspected weld seam that is not fused, and the corresponding cross-sectional view of the detection arrangement.
The distance from the depth of the incomplete fusion to the inner surface is 1.5mm.
Figure 3 (left) shows the principle of phased array fan-shaped sound beam detection and the shadow effect at the root of the V-groove single sided welding seam.
Figure 3 (right) shows the action of S scan plus D scan (probe moving along the weld axis direction or non parallel scanning), which can provide a "three degree" dimension of unfused material: length, height, and depth from the inner surface.
Note that when the linear array phased ultrasonic angle probe detects on one side of the diagram, the signal at the root of the weld seam (also known as the geometric signal) may be masked by the incomplete fusion defect signal.
If the probe is placed on the other side of the weld, both the defect signal and geometric signal images are visible.
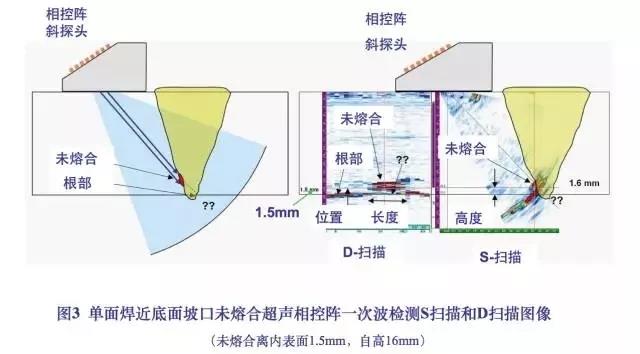
Figure 4 shows the phased array S-scan image of the groove near the upper surface of the inspected weld seam for non fusion detection using ultrasonic secondary wave (1.0S wave), and a cross-sectional view of the combined detection arrangement.
Figure 4 (left) shows the principle of secondary wave detection, explaining the mirror effect of sound beams and defects using double plate thickness; Figure 4 (right) shows the S-scan image and defect image covering the cross-section of the weld seam. The second wave extends the scan image of the first wave, and both the weld seam and defect are reflected in the image.
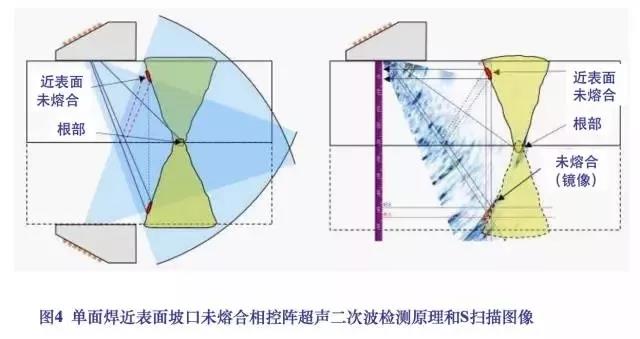
Figure 5 shows the phased array S-scan image of dense pores 1.5mm away from the upper surface detected by ultrasonic primary wave (0.5S wave).
The size of the pore group is: 1.5 × three × 10mm (measure its length range using a D-scan).
The left side of the figure shows the principle of phased array sound propagation, while the right side shows the S-scan image covering the weld cross-section and the acoustic imaging morphology of dense pores.
Pay attention to the recognition of welding root shape signals in S-scan images, which is equally important as the recognition of conventional A-scan shape signals (commonly known as false signals).
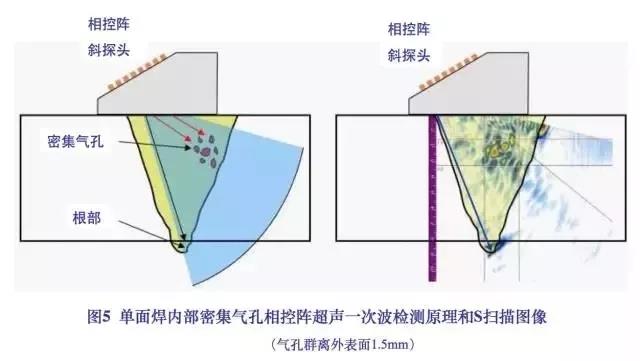
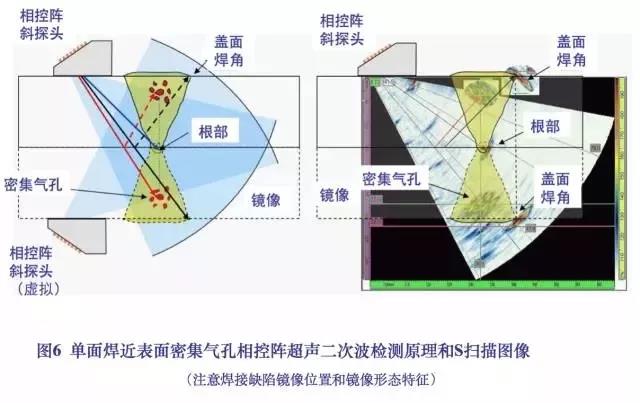
Figure 6 shows the phased array sector scan image and additional cross-sectional view of the detection arrangement for dense pores near the surface in the weld seam detected by ultrasonic secondary waves.
The left side of the figure shows the principle of sound propagation in phased array ultrasonic secondary wave detection, using double plate thickness to explain the mirror effect; The image on the right shows the phased array S-scan image and detection arrangement, as well as the ultrasonic sound path. Note the correspondence and specificity between the acoustic imaging features of the gas hole group, single side welding root, and cover welding corner (the junction between the reinforcement and the base metal) in the scanning image and the actual shape.
Understanding this feature will contribute to the characterization, qualitative analysis, and classification of phased array ultrasound imaging of welding defects.
2.6 Incomplete penetration at the root of the T-joint and incomplete fusion on the wing side
Figure 7 shows the phased array S-scan image of incomplete root penetration and incomplete fusion on the wing side in the T-joint combination weld seam.
The linear array longitudinal wave straight probe is placed on the surface of the wing plate side (the length of the active window of the probe array is perpendicular to the end face of the web plate), with a certain range of lateral movement and a phased array S scan of a certain angle range, to detect important defects in such welded joints (including incomplete root penetration, incomplete fusion on the wing plate side, as well as welding cracks and under pass cracks, etc.).
The phased array combination image obtained by S-scan on the wing side and longitudinal D-scan is very useful for locating and quantifying the aforementioned welding defects.
In addition, attention should also be paid to the recognition of defect signal images and weld geometry signals (i.e. surface shape signals).
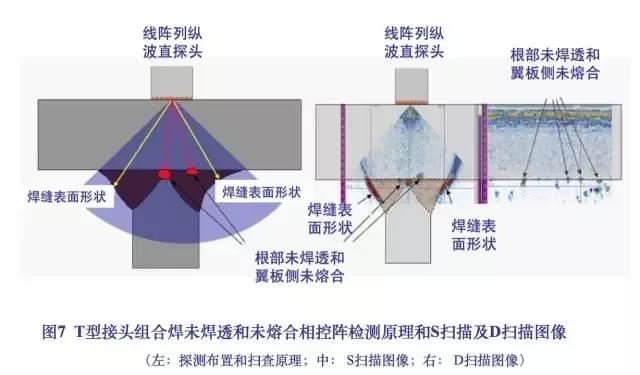
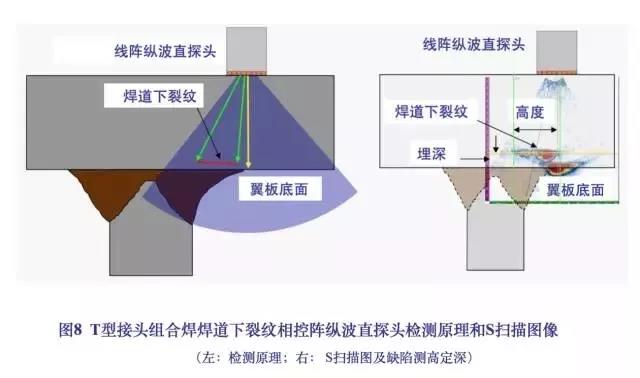
Figure 8 shows the phased array detection principle and S-scan image of the linear array longitudinal wave straight probe for cracks under the weld bead in the T-shaped joint.
In the S-scan image shown on the right, the height of the crack itself is measured using a vertical cursor, while the depth distance from the crack to the bottom of the wing plate is measured using a horizontal cursor.
Pay attention to the interception positions of the endpoint and feature points of the defect image when using the cursor to measure the height and depth of the defect.
Due to the limited accessibility of the inspected workpiece and the inspected part, sometimes the ultrasonic straight probe cannot be placed on the plane of the wing plate shown in Figure 8 for longitudinal wave scanning, and can only be detected on the other side of the wing plate (i.e. the side near the combination weld and web plate) using an oblique probe for transverse wave.
Figure 9 shows the crack under the weld bead on the wing side in the same T-joint (i.e. the joint shown in Figure 8). The phased array detection principle and S-scan image of the transverse wave secondary wave using a linear array angle probe on the other side of the wing are presented.
The left side of the figure represents the image effect of ultrasonic secondary waves and cracks under the weld bead explained by twice the thickness of the wing plate, while the right side represents the image morphology and quantitative (i.e. depth measurement and height determination) method of cracks under the weld bead in the S-scan image.
When quantitatively measuring the defect signal image, attention should also be paid to the issue of using vertical and horizontal cursors to measure the height and depth of the crack image under the weld bead (as shown in the figure, the height measurement value of the crack itself is 8 mm, and the distance measurement value from the detection surface depth is 1.4 mm).
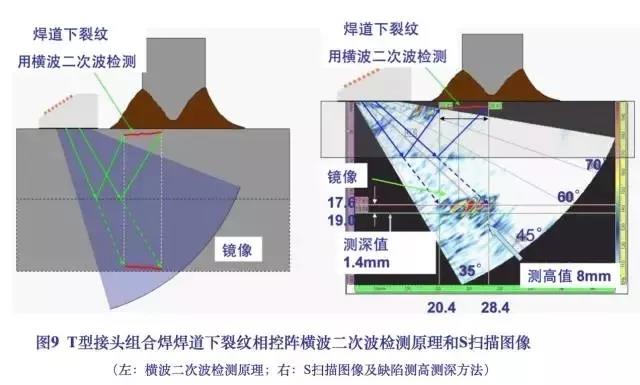
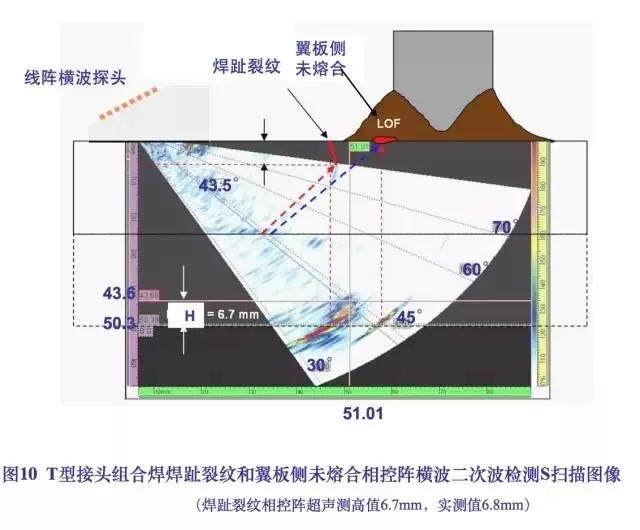
Figure 10 shows the S-scan image and corresponding detection arrangement (including the propagation sound path of the secondary wave) of the wing plate side weld toe cracks and incomplete fusion on the wing plate side in the T-shaped joint combination welding. The surface of the wing plate combination weld is detected using a linear array oblique probe transverse wave secondary wave for phased array detection.
The height of the weld toe crack measured by the horizontal cursor in the scanning image is 6.7mm, while the actual height of the crack is 6.8mm.
Similar to the phased array scanning image of the single sided weld toe crack in Figure 2 above, when the weld toe crack in the T-joint combination welding is scanned using transverse wave secondary wave, two feature images will also appear in the crack signal: the end angle reflection signal image and the tip diffraction signal image. Accurately moving the cursor and measuring the distance between the two feature signals are also important details for accurately measuring the height of the T-joint weld toe crack.
The ultrasonic phased array S-scan of the linear array probe can be used as an ultrasonic imaging tool.
During phased array detection, the S-scan image display of weld defects is easy to interpret and evaluate, and the defect signal and geometric signal images are easier to distinguish compared to the conventional A-scan pulse waveform.
The phased array S-scan image combined with a detection layout diagram containing sound propagation paths is an effective method for reading and resolving the spectrum of weld seam phased array detection. Especially when using secondary wave detection, it is necessary to be good at reading and understanding the actual position and morphological features of the mirror image.
(4) The depth and height measurement of defects can be evaluated based on S-scan images, and attention should be paid to the interception positions of vertical and horizontal cursors during measurement.
The combination of S-scan and D-scan can improve the quantitative characterization information of defects and obtain three-dimensional data of defects.
If the phased array scanning data is input into the 3D image and relevant design software packages are used, the defect morphology in the inspected workpiece can be reconstructed using the 3D phased array data.