Introduction
A comparison was made between the detection capabilities of digital radiographic testing (DR) and film radiographic testing (RT-F) for circumferential weld defects in oil and gas pipelines. Based on the detection principles of DR and RT-F, a test plan for DR and RT-F detection was developed, and artificial defect welds were designed and processed.
Comparative testing was conducted on artificial defect welds to compare the detection capabilities of DR and RT-F for different types of defects.
The experimental results indicate that digital radiographic testing and film based radiographic testing techniques can detect different types of defects through their respective equipment and process exposure parameters.
Radiographic Testing Method for Pipeline Circumferential Weld Inspection
The detection of pipeline circumferential welds is an important part of the pipeline construction process, and radiographic testing technology is currently the main detection method for long-distance pipeline circumferential welds.
However, the corresponding radiographic testing mainly uses film imaging technology (RT-F), which has a long testing cycle, low efficiency, and often affects the construction progress.
After long-term storage of radiographic films, some images may discolor or fade, causing the original film to be unable to review the original detection results. Digital radiographic testing (DR) technology solves the problems of traditional film storage and query, and can achieve real-time imaging of radiographic testing. It has the advantages of digital storage, defect image computer analysis, remote film evaluation, and is the development trend of radiographic testing technology.
However, there is not much experience in the application of DR engineering in China. Therefore, by designing and processing process welds containing different types of defects, DR and RTF were used for comparative testing to verify the reliability of DR application in the detection of circumferential welds in oil and gas pipelines.
1. DR and RT-F detection principles
1.1 RT-F detection principle
When RT-F uses radiation to penetrate the inspected workpiece, it detects the difference in the absorption capacity of radiation between the defective and non defective positions.
The position of the corresponding defect on the photosensitive film will form a large degree of latent image due to receiving more rays. The film undergoes darkroom processing such as developing, fixing, and drying to form a transparent image.
The evaluator can determine whether there are defects and the shape, size, and position of defects in the workpiece based on the contrast of the radiographic image.
The schematic diagram of RT-F detection principle is shown in Figure 1.
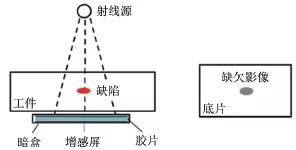
(Figure 1 RT-F detection principle)
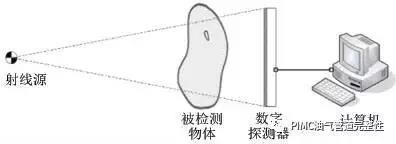
1.2 DR detection principle DR technology
By utilizing the penetration and attenuation characteristics of X-rays, a digital image that can be displayed and recorded can be obtained through a digital detector. The detection principle is shown in Figure 2.
During detection, the intensity of X-rays changes after passing through the tested object, and the attenuated photons are received and converted into visible light or electrons by a digital detector. After being read out and digitized through a circuit, the signal data is sent to a computer system to form an image that can be displayed, analyzed, processed, and stored, thereby achieving image digitization.
The detection process includes three stages: transillumination, signal detection and conversion, and image display and evaluation.
2. Comparison test between DR and RT-F
The radiographic method adopts the inner center method of the circumferential weld seam, which adjusts the focus of the X-ray machine to the center position of the circumferential weld seam. The circumferential exposure of the prefabricated artificial defect pipeline circumferential weld seam is carried out, and DR and RT-F are used for single wall single shadow detection of the artificial defect weld seam, respectively. Then, the results of the two detection methods are compared and analyzed.
DR and RT-F testing shall be carried out in accordance with the relevant provisions of Part 5 (Radiographic Digital Imaging Testing) and Part 4 (Radiographic Testing) of the standard SY/T4109-2013 "Non destructive Testing of Petroleum and Natural Gas Steel Pipelines".
2.1 RT-F system and process parameters
The X-ray machine model used is YXLONEVO300P, with a focus size of (wide × 0.5mm long × 5.5mm; The film is AGFAC7 type film; The linear image quality indicator is FE10-16.
The detection parameters are as follows:
Adopting central radiography method; The focal length is 711mm; The voltage is 260kV; The current is 2.8mA; The exposure time is 150 seconds.
2.2 DR system and process parameters
Adopting D/PTech's DR detection system; The X-ray machine model is YXLONEVO300P, and the focus size is (wide × 0.5mm long × 5.5mm; The pixel size of the digital detector is 127 μ M; Imaging area (length × 150mm wide × 150mm; The linear image quality indicator is FE10-16; The dual line image quality indicator is ISO19232H446.
The detection parameters are as follows:
Central radiographic method; The focal length is 726mm; The voltage is 260kV; The current is 2.5mA; The exposure time of a single image is 3.2 seconds.
2.3 Design and processing of artificial defect pipeline circumferential welds
Circumferential welds containing artificial defects shall be:
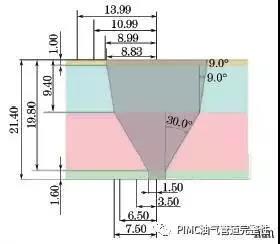
1422mm × 21.4mm (outer diameter × The X80 carbon steel pipeline with wall thickness (the same below) is processed and manufactured with a V-shaped weld groove.
The structure of the weld groove and the RT-F radiographic arrangement of the weld are shown in Figures 3 and 4.
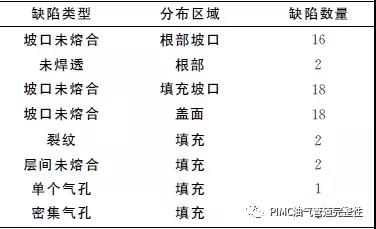
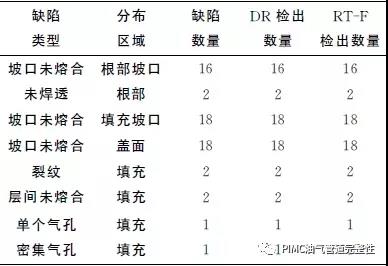
60 different types of welding defects were designed and processed in different height areas of the weld seam. The defect types include single pores, dense pores, incomplete fusion of the groove, incomplete fusion between layers, incomplete penetration at the root, and cracks. The information on the defect types and distribution areas is shown in Table 1, and the distance between defects is about 149mm.
 、
、
(图3 焊缝坡口结构)
(图4 RT-F检测的透照布置)
表1 缺陷类型及分布区域信息
2.4 Testing Procedures
2.4.1 DR detection procedure
(1) According to the inspected workpiece (1422mm × The diameter and wall thickness of the 21.4mm pipeline girth weld are calculated based on the exposure process parameters in accordance with Part 5 of the standard SY/T4109-2013 and the DR exposure curve.
(2) Set DR system parameters and perform DR detector calibration.
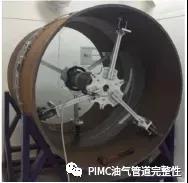
(3) Fix the track of the DR system onto the pipeline, install the DR image acquisition system on the track, and inspect the pipeline circumferential welds under effective radiation protection conditions.
(4) Determine whether the resolution, contrast, sensitivity, normalized signal-to-noise ratio, grayscale value and other image quality indicators of the detected image meet the standard requirements. If they do not meet the standard requirements, adjust the process parameters and retest until the image quality indicators meet the standard requirements.
(5) Evaluate inspection images that meet standard requirements, label defects, save inspection data, and generate DR reports.
2.4.2 RT-F detection program
(1) Calculate the exposure process parameters based on the pipe diameter and wall thickness of the inspected workpiece, as well as the content in Part 4 of the standard SY/T4109-2013 and the RT-F exposure curve.
(2) Process preparation before RT-F, including selection of X-ray machine model, selection of film and intensifying screen, determination of image quality indicator, marking, cassette, shielding plate, standard density film, etc.
(3) Under effective radiation protection conditions, RT-F shall be performed on the pipeline circumferential welds according to the calculated exposure process parameters.
(4) Develop, stop, fix, wash, and dry the exposed film to ensure that the contrast, sensitivity, blackness, marking, and apparent quality of the substrate meet the requirements of the standard.
If not, adjust the process parameters and retest until they meet the standard requirements.
(5) Evaluate the negative film according to standard requirements, record the location and size of defects, and issue a testing report.
2.4.3 Comparison of Two Methods
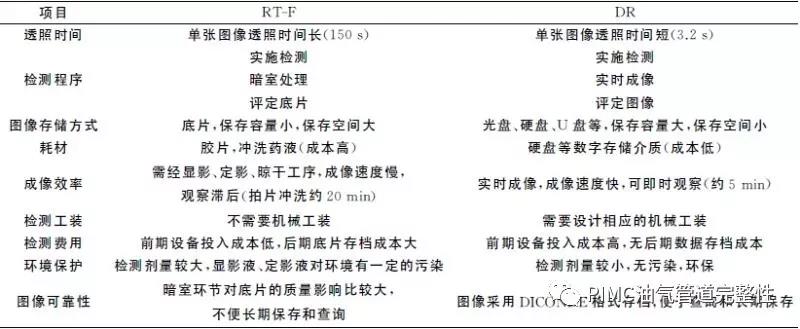
1422mm × The advantages and disadvantages of DR detection and RT-F detection methods for 21.4mm pipeline circumferential welds are compared in Table 2.
Table 2 1422mm × Comparison of advantages and disadvantages between DR detection and RT-F detection methods for 21.4mm pipeline circumferential welds.
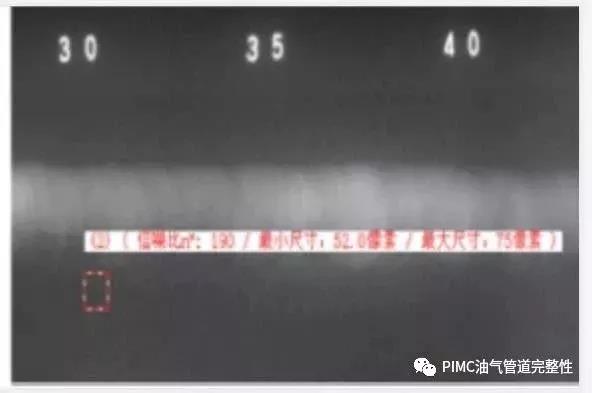
The image quality of DR was measured using PROFESSIONAL software, with an image resolution of D8, a linear image quality indicator sensitivity of W12, and a normalized signal-to-noise ratio of 190. The detection image quality met the requirements of standard Y/T4109-2013.
The measurement of DR image quality is shown in Figures 5-7.
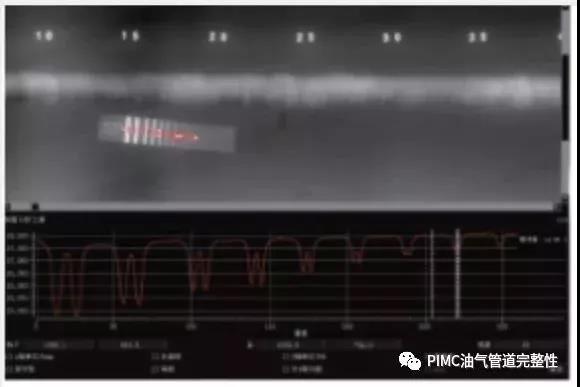
(Figure 6 Sensitivity of Linear Image Quality Indicator)
The comparison test results of DR and RT-F are shown in Table 3.
Comparing the defect details in digital images and negative films, both the DR method and RT-F method detected defects in the pipeline circumferential weld, and there were no missed detections.
However, there are differences in the length of defect display and the clarity of edges. By adjusting image contrast and other image processing methods, DR detection images can effectively improve the detection personnel's ability to observe defects and observe smaller defect details.
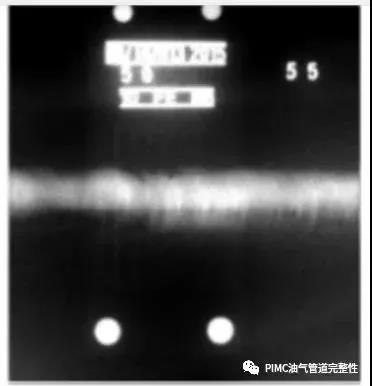
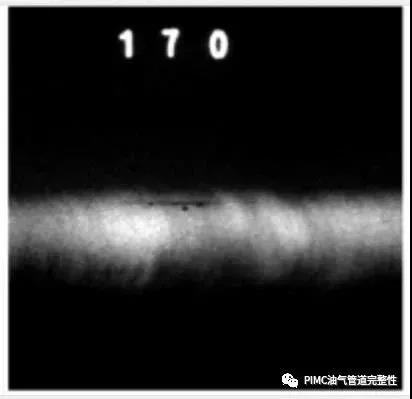
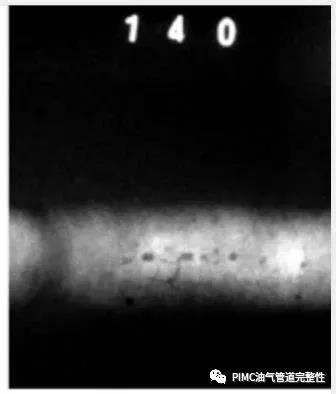
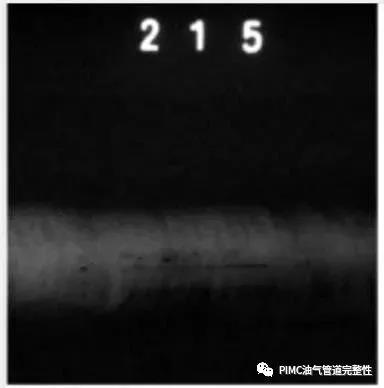
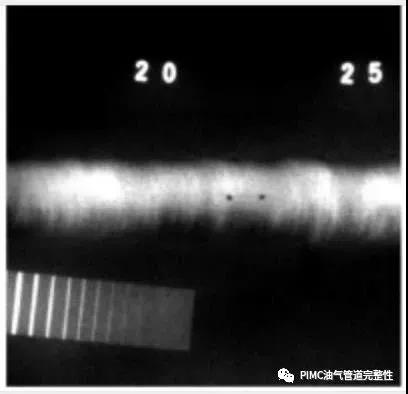
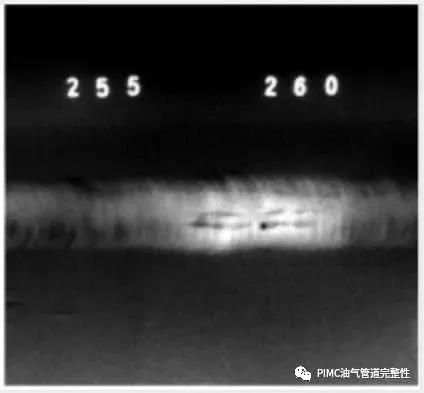
DR detection images of different types of defects are shown in Figures 8-13.
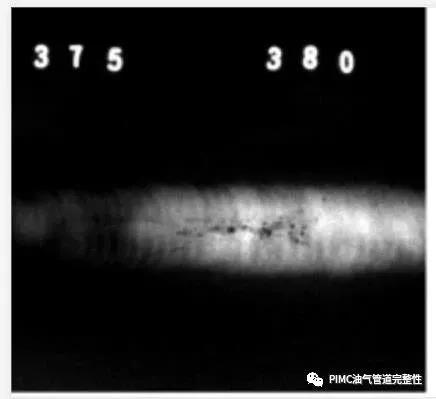
(Figure 8 DR image of dense pores)
(Figure 9 DR image of incomplete fusion at the groove)
(DR image of crack in Figure 10)
(DR image of incomplete root penetration in Figure 11)
(DR image of pores in Figure 12)
Two different radiographic testing methods, DR and RT-F, were used to compare the detection capabilities of the two methods for different types of defects in the butt circumferential welds of processed pipes containing defects.
The experimental results show that both DR and RT-F detection methods can detect defects such as pores, incomplete fusion of grooves, incomplete fusion between layers, incomplete root penetration, and cracks in pipeline circumferential welds;
In terms of image sensitivity, DR and RT-F levels are equivalent, and both can see the linear image quality indicator W12;
In terms of image resolution, the dual line image quality indicator index of DR image is slightly lower than that of RT-F;
In terms of signal-to-noise ratio, the signal-to-noise ratio of DR images is much higher than that of RT-F;
Due to the fact that the recognition ability of detection image details depends on the effective attenuation coefficient, signal-to-noise ratio, and image resolution of the inspected weld seam, DR can observe smaller defect details, and the defect size of DR images is slightly larger than that of RT-F.
DR meets the development requirements of digital pipelines and has gradually been applied in oil and gas pipeline inspection, with broad development prospects in the future.